Hi,
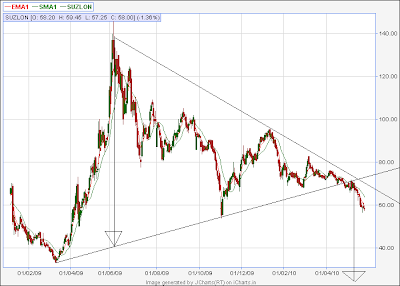
I have been follow Suzlon for sometime now.Being a follower of technical analysis and chart patterns,I noticed this Symmetrical Triangle Pattern.If a stock breakouts or breakdown from the converging trend lines,it is believed that it will continue to move in the respective direction.A target is generally equal to the width of triangle.This method is popularly known as "the measuring move" with respect to chart patterns analysis
Check the chart given below of Suzlon, as it broke down and made a Symmetrical Triangle Pattern.The measuring move target will be approximately -30 (minus 30) as the width of triangle is 100 and it broke down from 70 level.If it had broken the trend-line on the upside, the the target would have seemed possible,specially as we are in this bull trend.
Now -30 is impossible so we will swiftly do away with this chart pattern.But if we see a similar chart pattern in an intraday chart,we will trade it,and might trade it profitably.That reinforces our belief in chart patterns.
I have got nothing against chart patterns.I just want to highlight the psychological aspect of how we process the information which we get by charts as per our convenience.We bend the rules to prove our point.Just as I have done here!! Uploaded an obvious failed chart pattern out of so many successful chart patterns.But I want you to think about it's effectiveness when logically the target sounds possible......so will it work with some other stock, some other time ?
Related Post
Trying hard to convince my friends with "ridiculous analysis"
I have been follow Suzlon for sometime now.Being a follower of technical analysis and chart patterns,I noticed this Symmetrical Triangle Pattern.If a stock breakouts or breakdown from the converging trend lines,it is believed that it will continue to move in the respective direction.A target is generally equal to the width of triangle.This method is popularly known as "the measuring move" with respect to chart patterns analysis
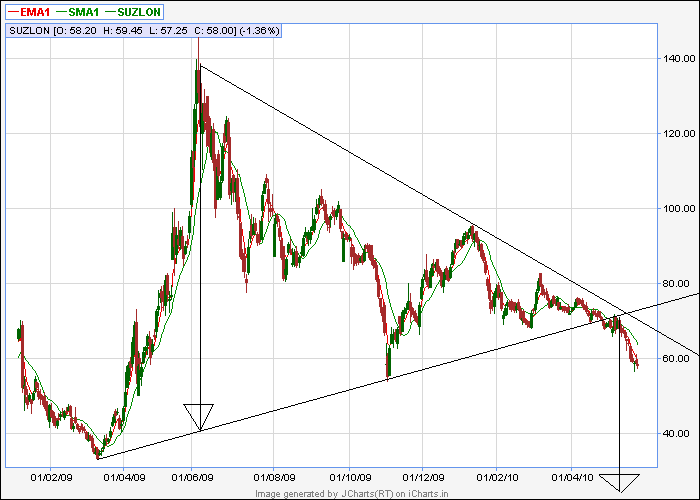
Check the chart given below of Suzlon, as it broke down and made a Symmetrical Triangle Pattern.The measuring move target will be approximately -30 (minus 30) as the width of triangle is 100 and it broke down from 70 level.If it had broken the trend-line on the upside, the the target would have seemed possible,specially as we are in this bull trend.
Now -30 is impossible so we will swiftly do away with this chart pattern.But if we see a similar chart pattern in an intraday chart,we will trade it,and might trade it profitably.That reinforces our belief in chart patterns.
I have got nothing against chart patterns.I just want to highlight the psychological aspect of how we process the information which we get by charts as per our convenience.We bend the rules to prove our point.Just as I have done here!! Uploaded an obvious failed chart pattern out of so many successful chart patterns.But I want you to think about it's effectiveness when logically the target sounds possible......so will it work with some other stock, some other time ?
Related Post
Trying hard to convince my friends with "ridiculous analysis"
Dear Anuj
ReplyDeleteOn a lighter side - that means the buyer of Suzlon will get 30Rs. :)
Hello Anuj,
ReplyDeleteCan you please tell me what is the nearest support for this stock. I have one lot and would like to average it.
@ rm
ReplyDeletebuy of suzlon will get 30?....plus thirty?
chart pattern says minus thirty
explain karo rm ji...couldn't understand the joke
Holding my laughter!!
Are bhai,
ReplyDeleteI am talking about after reaching the target, if price is 30 then you pay 30 to buy it, if it is -30 you get 30 to buy it. Elementary, my dear Watson!!!
Hi Anonymous
ReplyDeleteWell dont take this example too seriously...I just took this chart to explain chart patterns
Now the trade
As it is quite evident from the chart its going down...support will be @ 54 last major pivot of early November
Now I have absolutely no idea about your risk appetite,how much volume you are trading,what levels you entered. 56.45 low made a few days back is another support (short term)
Coming to main point
NEVER AVERAGE YOUR LOSING TRADE
Averaging your losing trade that too in Futures will blow up your account.
Now you dont have to look for that info anywhere else
just check the link below
http://financeandtradingmadeeasy.blogspot.com/2010/01/21-january-day-i-always-remember.html
So get out of that losing position ...place a stop first...and then decide a target if we get a bounce due to expiry or global reasons then its good.If your initial objective of trade doesnt stand right now, you need to exit...in a losing trade(holding a position beyond your "mental stops") market has already told you that all the reasons that you considered for the trade and planning was wrong...accept it and move out
There are opportunities every day in the market...very soon you will get a new one...if your method and discipline is right ...you will see positive returns
Good luck to you
Cheers
@ r m
ReplyDeletehe he...finally broke-out!!....laughing
thanks for relieving the pressure
Actually never imagined a stock trading in negative...so that part of mathematics is poor :)
Hi
ReplyDeleteCan you tell me where to get charts for individual stocks for min 5 years and a site which has the TA tools too!!
Thanks
Shazia
Hi Shazia
ReplyDeleteyou can register with ICharts...It's free..Then you can access....what they call as "JCharts (EOD)"
make changes in chart settings and you will get the charts for the past 10 years!!
Shazia
ReplyDeleteI am really thankful to you
I never knew that we could get 10 years data
thanks...very interesting long term charts
Thank you Anuj, I read your story too :( Feel sorry, I too had similar experience when I started with Options , when I did madly average(lost 40K) and then with FNO - Minifty (lost 40K) again. This was a year back.
ReplyDeleteNow I think I am doing the same mistake again. I bought 1 lot May contract for 73 with a target of 80. Now I am struck. I didnt want to average (not to repeat my earlier mistakes) Currently I am selling it and buying back again every day so as to reduce my loss. Still I am around 22 K Loss.
I have enought capital for another 10 points down. I have just rolled over the contact to June. If there is some signs of recovery, I would like to average and exist this counter or should I just book out my loss at some point and exit.
Still Undecided which one to choose.
Thanks again for your valuable time.
@Anonymous
ReplyDeletehalf of our problems get resolved if we dont repeat our mistakes
Keeping a trading diary or records of our previous trade always helps, more than any tips or indicators
There is tremendous information and knowledge in our previous trades..provided we keep track of them.
wish you good luck in finding your exit and also finding your next profitable trade :)
:-) I need all the luck in this world. Will update once i exit
ReplyDeleteThank you
Hi,
ReplyDeleteThanks or suggesting. will go through it .. i like to see the macro picture.. gives me more confidence !!
thanks to you
Shazia